My statistics are rusty, but here's what I'm trying to do. Creating an application around football and have this distribution around rushing yards per attempt.
http://farm3.static.flickr.com/2580/3813734078_7801aab534_o.png
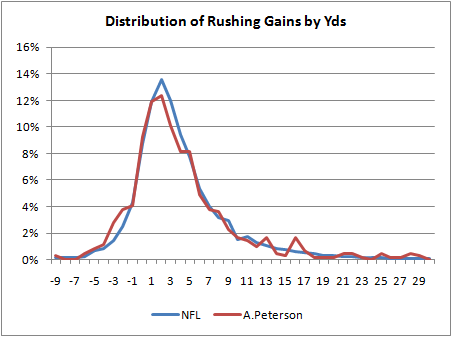
I'm just looking at the NFL average in the chart. Basically, I want to create a random number generator that gives me a number along that distribution. I'll want to do the same for passing too. Since this is football, I'd like to generate from roughly -10 to 100.
I reverse engineered the plot in Excel, but my memory is absolutely failing on how I can create or fit a known distribution to this plot. I left my math skills behind in college and have just been doing general programming since.

You don't need a known distribution, just a computable function that approximates the curve closely enough. You can get fancier but if you generate pairs of uniform random variables using an acceptable PRNG, scaled so one is on your -10,100 scale and the other is 0 to the max value of your approximation function. Call the first one x and the second y, if f(x) > y then accept x as the next value. Otherwise discard both x and y and generate a new pair. The distribution of accepted x values will follow the curve.
Efficiency can be poor if f has long thin tails. Than you need to generate x from a non-uniform distribution g that approximates f but dominates it and y on [0,1), accept when y < g(x)/f(x). But that's just for efficiency, it will work as described above.