I have a population that can be subdivided into sub-populations (e.g., a sack full of Apples,Pears,Oranges). Every item shares a binary attribute (e.g.,ripe:true/false). I want to figure out if one of the sub populations (e.g., Apples) significantly differs from the rest (are significantly more frequent riper). As this is a comparison of categorical values I figured that chi-squared is the appropriate test. However, I do not know how to proceed.
My $H_0$ would be: Apples are not significantly more frequently riper than the other fruits.
I could have one degrees of freedom as I could have
(a) $Apple \land Ripe$ vs. $\neg Apple \land Ripe$
I could also have two degrees of freedom, as I have Apple, Pears, Oranges.
(b) $Apple \land Ripe$ vs. $Pear \land Ripe$ vs. $Orange \land Ripe$
Assuming the measurement table
| / | Apple | Pear | Orange |
|---|---|---|---|
| Ripe | 70 | 50 | 50 |
| $\neg$ Ripe | 30 | 50 | 50 |
On average 170/300 fruits are ripe (i.e., 56%).
(a) $\frac{(70 - 56)²}{56} + \frac{(100 - 112)²}{112} = 4.7058825$
(b) $\frac{(70 - 56)²}{56} + \frac{(50 - 56)²}{56} + \frac{(50 - 56)²}{56} = 4.7058825$
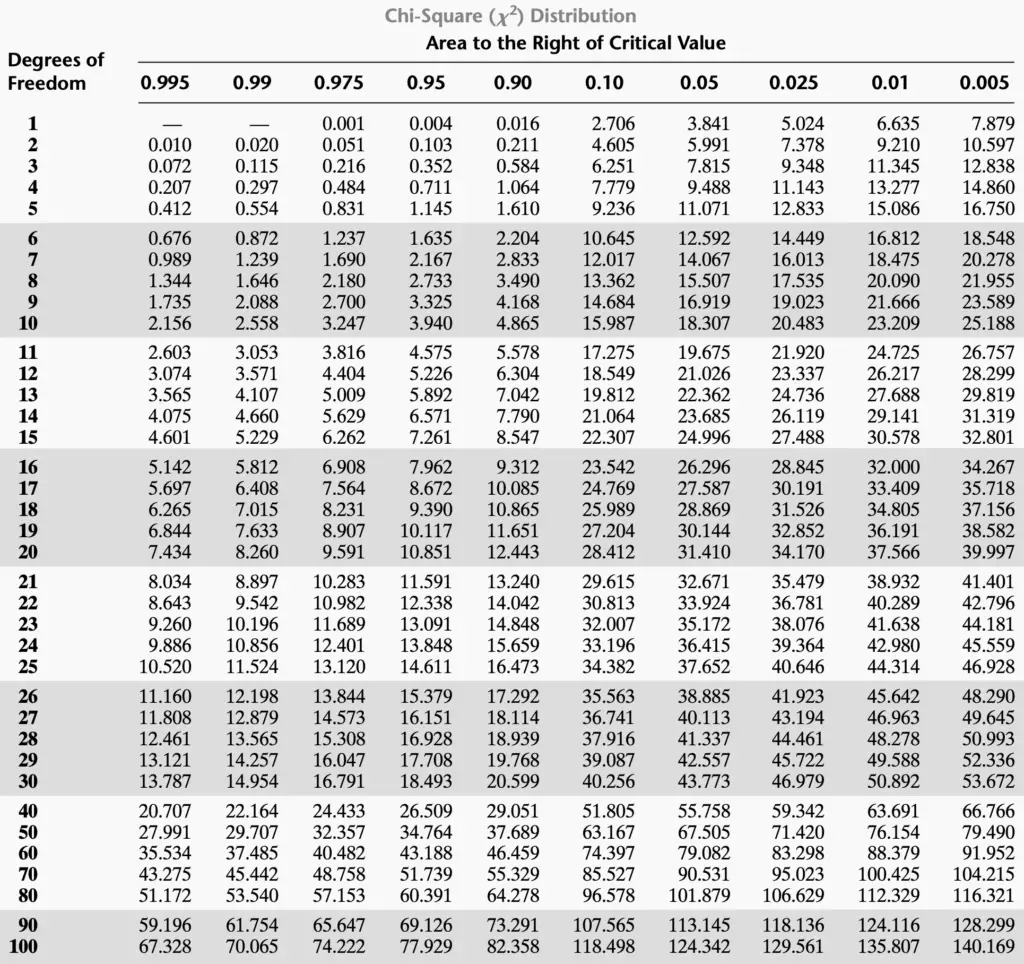
Either degree of freedom yields the same number however using the value for 0.05 (3.841 for 1 degrees vs. 5.991 for 2 degrees) from the corresponding table we have different conclusions now. I.e., assuming two degrees of freedom we can reject H0, assuming three degrees of freedom we cannot.
How can I formulate/calculate the chi-squared test for my problem?
This question on cross validated would suggest that (b) is correct, however, the OP does not specify the hypothesis tested. Furthermore, assuming that I would want to apply the test to the hypothesis that oranges are not more frequently ripe than the other fruits I would write down the same equation, this lets me doubt the proposed $(columns-1)(rows-1)$ rule.

The chi-squared test of association uses as its null hypothesis the statement that there is no association between the factors and the outcomes. So in your case, what this means is that the type of fruit is not associated with the proportion that is ripe. Equivalently, if we let $p_1, p_2, p_3$ represent the true proportions of ripe fruits of each type (apple, pear, and orange, respectively), $$H_0 : p_1 = p_2 = p_3$$ is the null hypothesis, and $$H_1 : \exists p_i \ne p_j$$ for some distinct $i, j \in \{1, 2, 3\}$. That is to say, the alternative hypothesis is that there exists some difference in the proportion of ripe fruits by fruit type, but the test does not indicate which types are different.
If you want to test whether a specific fruit type has a different proportion of ripeness compared to the other types, then you need to construct the corresponding hypothesis accordingly; e.g., in the case of investigating apples in particular, you want to test $$H_{01} : p_1 = p_{23} \quad \text{vs.} \quad H_{11} : p_1 \ne p_{23},$$ where $p_{23}$ is the true proportion of ripe fruits among non-apples, which in your case are the pears and oranges considered as a pooled group. This results in a test that is reduced to an independent two-sample binomial proportion statistic.
However, if you do multiple pairwise comparisons in this way, you will encounter an issue with controlling the familywise Type I error rate, because although each individual comparison is controlled at some level $\alpha$, the non-independence of each test as well as the calculation of multiple hypothesis tests itself, will mean that the overall Type I error will not be controlled at the same $\alpha$. An adjustment, such as the Bonferroni method, will be necessary.