I've got this graph of the ampere output of an alternator:
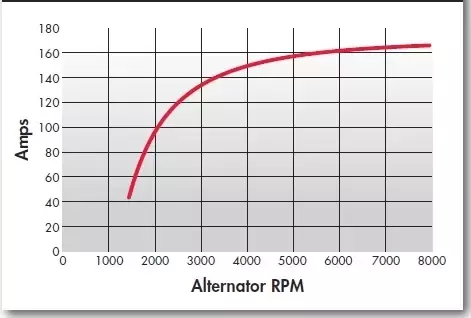
or as a table read off the graph:
| RPM | Ampere output |
|---|---|
| 1450 | 42 |
| 2000 | 97 |
| 2500 | 120 |
| 3000 | 133 |
| 3500 | 143 |
| 4000 | 149 |
| 4500 | 152 |
| 5000 | 156 |
| 5500 | 159 |
| 6000 | 162 |
| 7000 | 164 |
| 8000 | 166 |
which I need to approximate using a formula, $x$ being the alternator speed in RPM (rotations per minute) and $y$ being it's output in amperes.
I've tried using the various logarithmic, square root and cubic root functions, but none of the graphs produced by those came close to the graph above.

Sometimes to get a good fit you need to apply a transformation to the data. I tried shifting the data horizontally to the left by 1350 amps. This is accomplished by subtracting 1350 from each of your RPM values. I was able get a pretty good logarithmic fit with a R^2 of 0.9899. The 1350 was found just by trial and error, you might find there is a different value which is more optimal.
My fit equation is,
$$Y = 30.811 \ln(X-1350) - 98.15, $$
where $Y$ is the number of amps of current and $X$ is the number of rpm's from the alternator.