Imagine a scratch ticket lottery game with the following prizes.
Value        Number of Tickets
$100         4
$10          40
$1           100
$0           846
If I buy 10 tickets, what range can I expect the sum of the values of those 10 tickets to be within 66% of the time. What about 95% of the time?
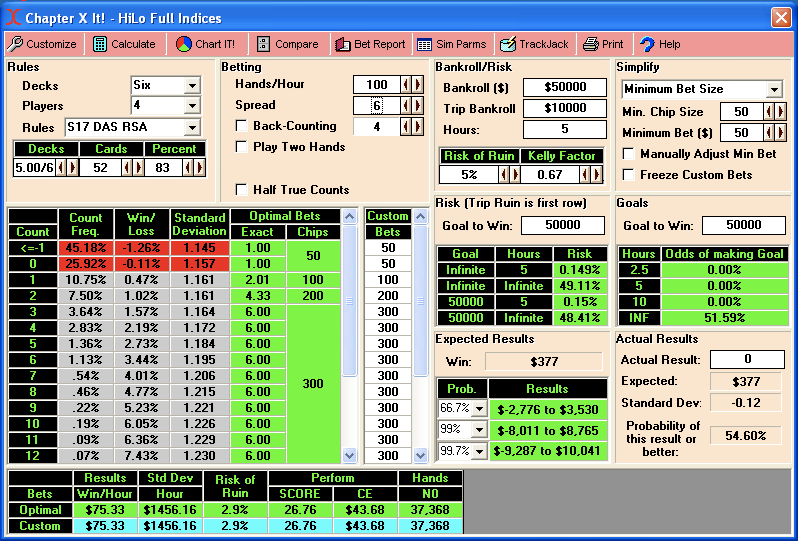
I'm trying to learn the math behind the "Expected Results" table of the following image. https://www.blackjackapprenticeship.com/wp-content/uploads/2017/05/picture-2.png
That image says that if you play 500 hands of the specified strategy, you can expect to be -\$2,776 or +\$3,530 66% of the time. How does it figure that? What is the function to determine that?
Thanks!

The example picture of a blackjack simulation doesn't really apply to lottery games. Results of hands of blackjack are close to normally distributed. Lottery games are usually not normally distributed.
Imagine a \$1 lottery scratch off game with 9,999 \$0 prizes and a single \$10,000 prize. It doesn't make sense to think in terms of "If you buy 100 tickets, then 66% of the time you'll be between -\$100 and +\$100." (Or whatever 1 standard deviation of that game would be). That's just not useful info. Most of the time, you'll be at -\$100 and a small percentage of the time you'll be at +\$10,000.
So it's not as simple as calculating the mean and standard deviation and plugging that into the normal distribution function. The function for lottery games is a lot different and it might be best to simulate the game, create a histogram of results, and then line-fit the results using software like Python's Scikit-Learn.