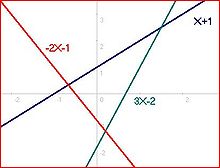
Let's say we have an inconsistent set of three linear equations in two variables. We can interpret these as three lines forming a triangle in the plane:
Let us write this in matrix form as
$$A \begin{bmatrix}x \\ y\end{bmatrix} = b$$
If we now "solve" this system by determining
$$ \begin{bmatrix} \hat x \\ \hat y \end{bmatrix} = \arg\min \left\Vert A \begin{bmatrix}x \\ y\end{bmatrix} - b \right\Vert_2^2$$
is there a geometric interpretation of the point $(\hat x, \hat y)$ with respect to the triangle?
If so, is there a way to extend this notion to higher dimensions and/or more equations?
EDIT: I noticed that my quesiton was ill posed: You can scale any of the three equations with some nonzero factor and get a different minimizer so in that sense my original question was ill posed. Let us now assume that all the equations are normalized, that is, that each row vector of the matrix $A$ has norm $1$.

If the rows of $A$ are normalized to 1, then the expression $$ \left( A_i \left[ x \atop y\right] - b_i\right)^2,$$ where $A_i$ is the $i$th row of $A$, denotes the distance of the point $(x,y)$ to the $i$th face of the polygon. Then, $$\left\| A \left[ x \atop y\right] -b \right\|^2$$ is the sum of the squared distances of the point $(x,y)$ to all faces of the polygon and you are looking for the point that minimizes this sum of distances.
In two dimensions, and with three lines, that would be the symmedian, or Lemoine, point.
Code to generate the figure