Graph the rational function $f(x)=\frac{-4}{-x-2}$
Please help me figure out how to start this problem.
Graph the rational function $f(x)=\frac{-4}{-x-2}$
Please help me figure out how to start this problem.
 On
On
Do you know how a rectangulay hyperbola $xy=k$ looks like? For positive k, it looks like (http://intmstat.com/plane-analytic-geometry/xyis1.gif)
Edit: $f(x)=\frac{-4}{-x-2}=\frac{4}{x+2}$ My link already shows how to plot $y=f(x)=\frac{1}{x}$. Npw to plot, $f(x)==\frac{1}{x+2}$ , pretend that the X=-2 line is the real Y axis, and plot the original graph. (Now change the graph slightly to get $f(x)=\frac{4}{x+2}$.)
On
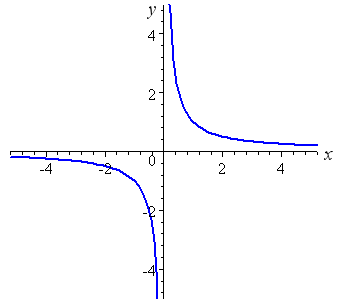
Start submitting values for x and calculate f(x)
f(0)=4/2=2
f(1)=4/3=1.3
f(2)=4/4=1
f(3)=4/5=0.8
f(4)=4/6=0.67
f(5)=4/7=0.57
and so on and so forth.
If you start plotting, you would realize that f(x) is close to zero but is never zero. If f(x) were on the y-axis, then this is how the graph would look like.

In the future, please explain what you have already tried and what you are having trouble with.
$ \textbf{Hint:} $ Find the domain of $f(x)$. Are there any discontinuities? Vertical? Horizontal? What is the limiting behavior the function? (i.e. what does the function do as $x$ gets really large, or really small?)