I skipped Algebra I in school, and we have Mathematics midterms next week. While going through our review packet, I noticed graphing absolute values, something I had never seen before.
I've figured out the basics: $|x+n|$ translates the graph $n$ units along the x axis, $|x|+d$ translates the graph $d$ units along the y axis, and $-|x|$ flips the graph so it opens downward.
What happens, however, if we have $a|x|$, or $|ax|$? Is there an easy short hand way to draw this, or do I have to make a chart of the points and graph them one by one?

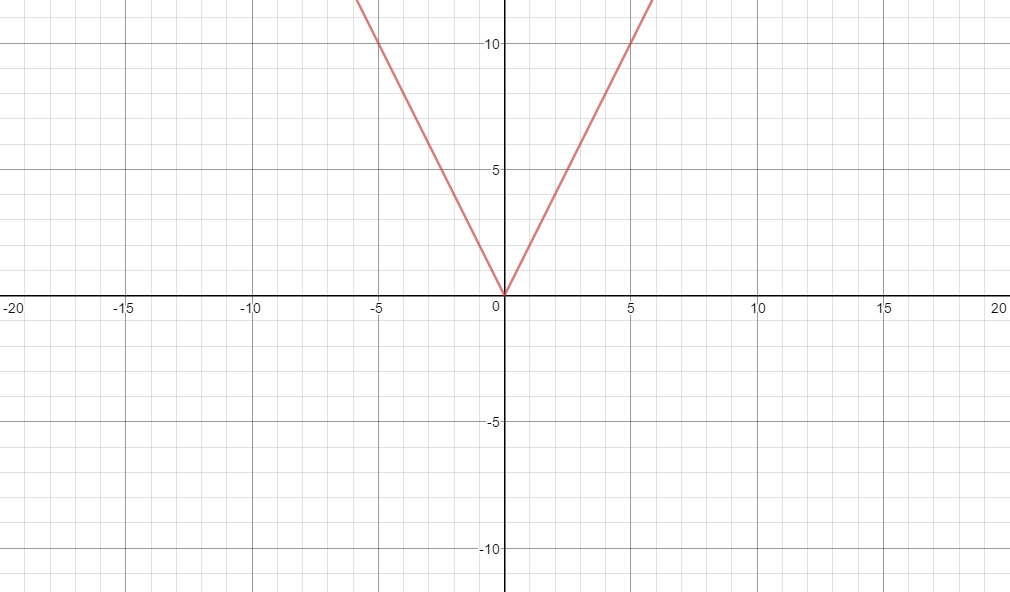
 But, if $a=2$,
$\lvert x + n \rvert$ is the graph of $\lvert x \rvert$ translated $n$ units to the left if $n > 0$. If $n< 0$ it will translate to the right. $n=0$ changes nothing. E.g. the tip will move from $x=0$ to $x=-n$.
You can fiddle with it here.
$\lvert x \rvert + d$ is the graph of $\lvert x \rvert$ translated $d$ units upwards if $d > 0$. If $d < 0$ it will get translated downwards. E.g. the the tip will move from $y=0$ to $y = d$.
You can fiddle with it here.
$-\lvert x \rvert$ is the graph of $\lvert x \rvert$ mirrored along the $x$-axis.
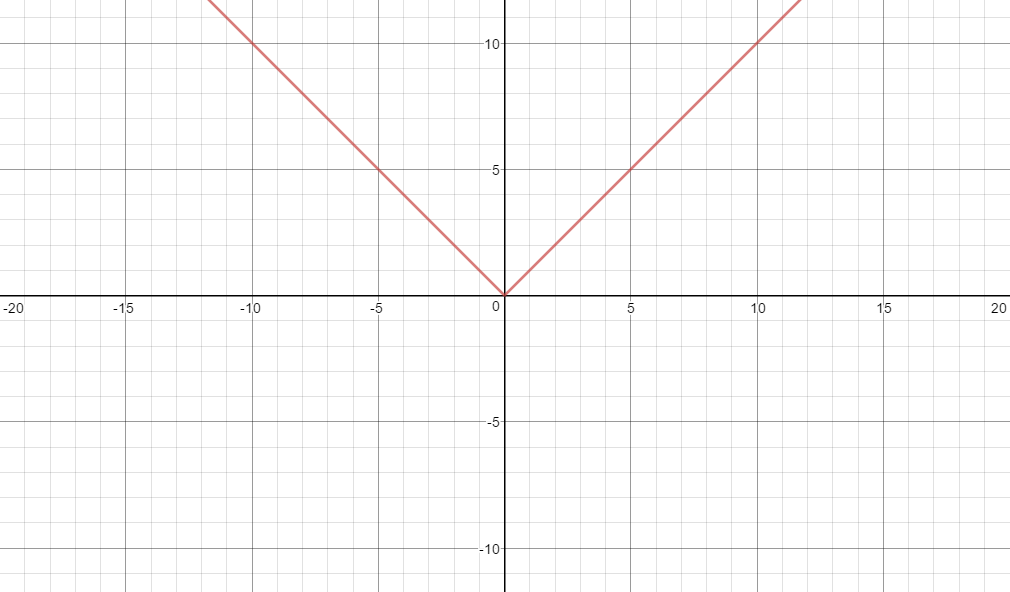
$a\lvert x \rvert$ squeezes the graph of $\lvert x \rvert$ horizontally with growing $a$, if $a>1$. E.g. $(1,1)$ will get mapped to $(1,a)$. If $a = 1$ nothing changes. If $a \in (0,1)$ then the graph will widen horizontally. If $a = 0$ the graph will flatline to the constant zero function.
If $a$ is negative one will have an additional mirroring at the $x$-axis.
You can fiddle with it here.
$\lvert a x \rvert$ is just $\lvert a\rvert \lvert x \rvert$. This leads to a different dynamics, as there are no negative factors anymore compared to the previous example.
You can fiddle with it here.